
The biggest challenge in genomic research isn’t just identifying genes or variants associated to a disease—it’s determining which ones are robust enough to guide drug target decisions, reduce risk in discovery, and maximize precision medicine outcomes. That’s where the DISGENET Score becomes indispensable.
For anyone new to the platform, the DISGENET Score (available as GDA Score and VDA Score) is one of the first metrics you should understand. It is often your first port of call to prioritize the most reliable associations and uncover new areas worth exploring.
In this article, we’ll explain what the Scores are, how they’re calculated, what different values mean, and share detailed examples.
What Are the GDA and VDA Scores?
- GDA Score: Quantifies the strength of evidence for gene–disease associations.
- VDA Score: Quantifies the strength of evidence for variant–disease associations.
Both scores answer the same critical question: How confident can you be in this association?
Why the Score Matters
When you query DISGENET, you’ll often see hundreds or even thousands of associations. Without a way to evaluate reliability, it can be overwhelming. The Score solves this problem by letting you:
- Focus on well-supported associations rather than every possible hit.
- Prioritize results without manually checking every source.
- Use high scores for established research and low scores for potential discovery.
For pharma and biotech researchers, high GDA and VDA Scores can also help accelerate drug target validation, support drug repurposing decisions, and prioritize precision medicine candidates.
For researchers and bioinformaticians, this means more efficient workflows and more reliable insights.
How the DISGENET Score Is Calculated
Both GDA and VDA Scores range from 0 to 1. The closer to 1, the stronger the evidence. The calculation takes into account multiple layers of data:
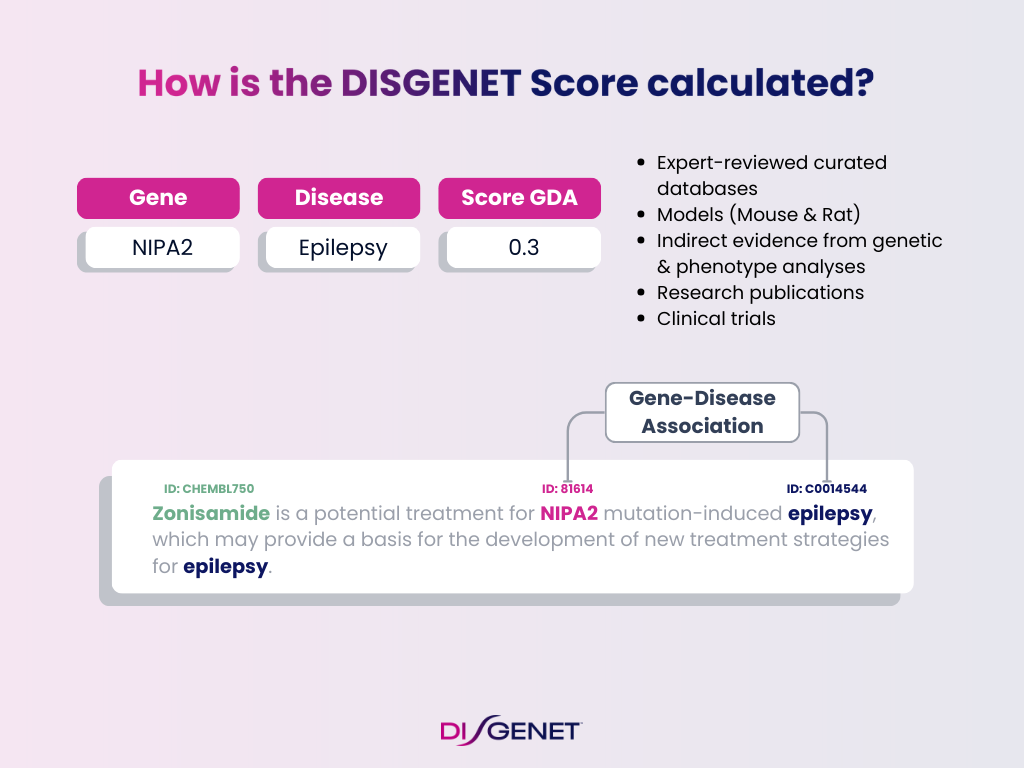
Evidence Components for GDA Score
- Curated databases (CURATED): Expert-reviewed resources like ClinGen, ClinVar, UniProt, Orphanet
- Animal models (MODELS): Mouse and rat evidence, including text-mined sources.
- Inferred evidence (INFERRED): Genetic and phenotype analyses.
- Research publications (LITERATURE): Scientific publications indexed in PubMed.
- Clinical trials (TRIALS): Evidence from ClinicalTrials.gov
Evidence Components for VDA Score
- Curated variant databases
- Genetic study results such as GWAS and PheWAS
- Text-mined publications
Each evidence type contributes a weight. The sum results in the final Score.
Interpreting the Score: Examples
Scores are not abstract numbers — they reflect concrete evidence patterns. Let’s walk through three examples.
Note: The examples in this blog are for illustrative purposes. DISGENET updates its data every quarter, so GDA and VDA Scores and their underlying evidence often changes over time. This ensures you always have access to the most current and reliable associations.
High Score Example: LMX1B – Nail-Patella Syndrome
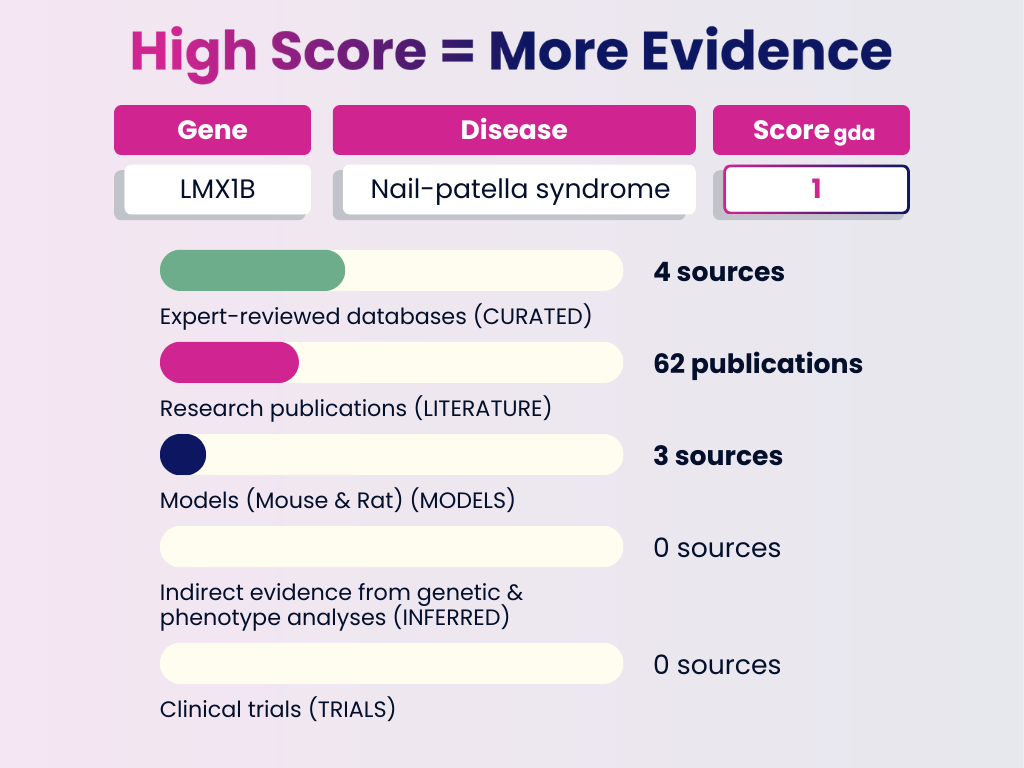
Interpretation: This association is strongly supported across curated databases, publications, and models. A GDA Score of 1.0 indicates a highly reliable link — the type of evidence you can use to validate or confirm established disease mechanisms.
GDA Score = 1.0
Numbers in brackets represent the weight each evidence category adds to the final GDA Score. The total of all evidence contributions results in the score you see (0–1).
- Curated Sources: 4 expert-reviewed databases (0.6)
- Publications: 62 research publications (0.3)
- Animal Models: Evidence from in RGD, MGD, or literature (0.1)
- Inferred Evidence: None
- Clinical Trials: None
Medium Score Example: CARD10 – Primary Open-Angle Glaucoma
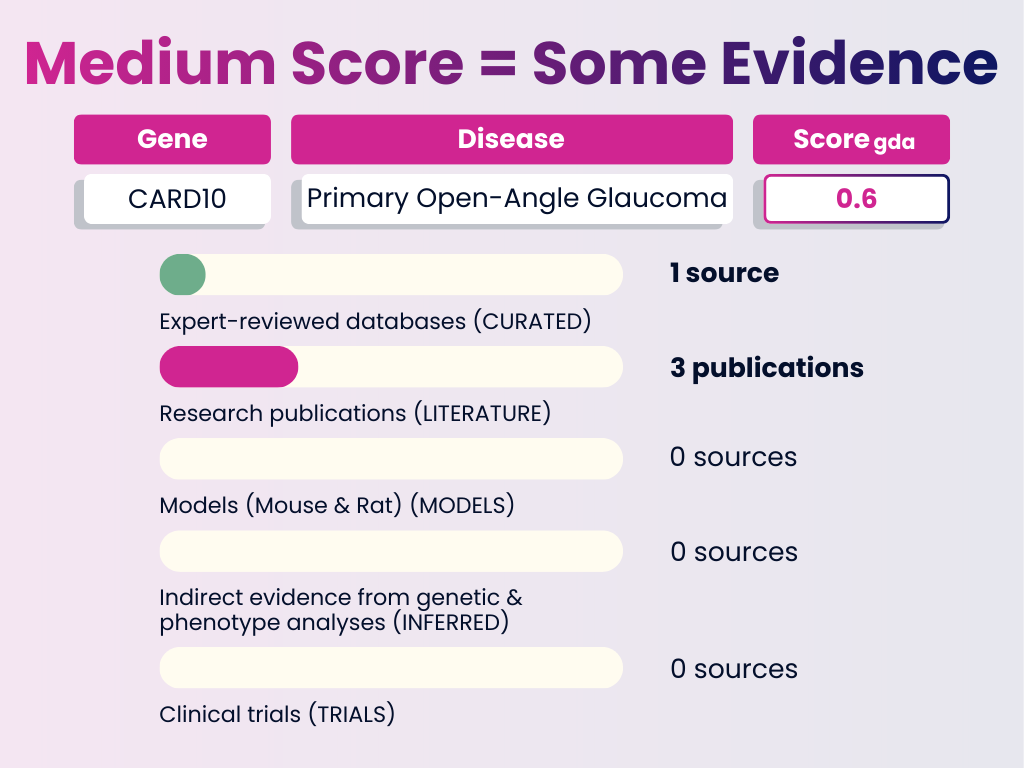
Interpretation: A moderate level of confidence. Most of the weight comes from curated databases with supporting literature. This is a good candidate for further functional validation.
GDA Score = 0.6
Numbers in brackets represent the weight each evidence category adds to the final GDA Score. The total of all evidence contributions results in the score you see (0–1).
- Curated Sources: 1 expert-reviewed database (0.4)
- Publications: 3 publications (0.2)
- Animal Models: None
- Inferred Evidence: None
- Clinical Trials: None
Low Score Example: GLI2 — Primary Congenital Glaucoma
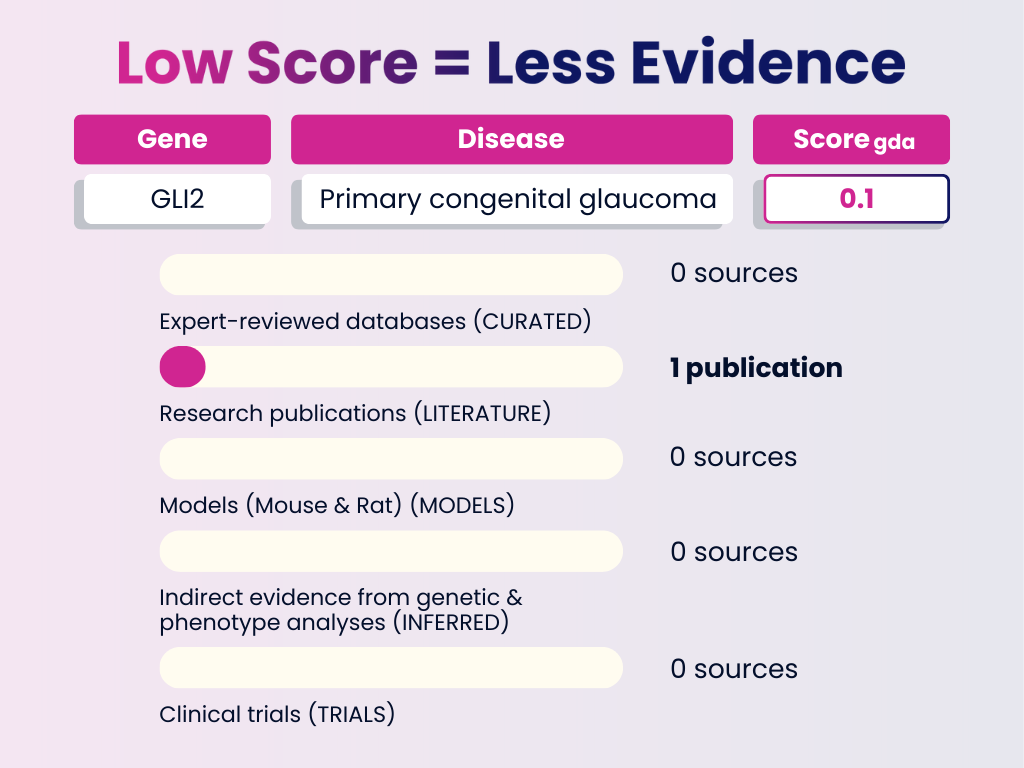
Interpretation: Limited evidence, based solely on a single publication. Low-score associations like this are exploratory — not yet reliable, but valuable for identifying novel or underexplored research avenues.
GDA Score = 0.1
Numbers in brackets represent the weight each evidence category adds to the final GDA Score. The total of all evidence contributions results in the score you see (0–1).
- Curated Sources: None
- Publications: 1 publication (0.1)
- Animal Models: None
- Inferred Evidence: None
- Clinical Trials: None
Practical Use Cases
- High scores (0.9–1.0): Confirm known associations in clinical or translational research.
- Medium scores (0.4–0.7): Prioritize for functional validation or experimental follow-up.
- Low scores (≤0.3): Spot novel associations for hypothesis generation or early exploratory research.
This flexibility means the Score supports both safe bets and high-risk, high-reward science.
Where to Find the Score on the Web
The GDA and VDA Scores are built into the DISGENET web interface:
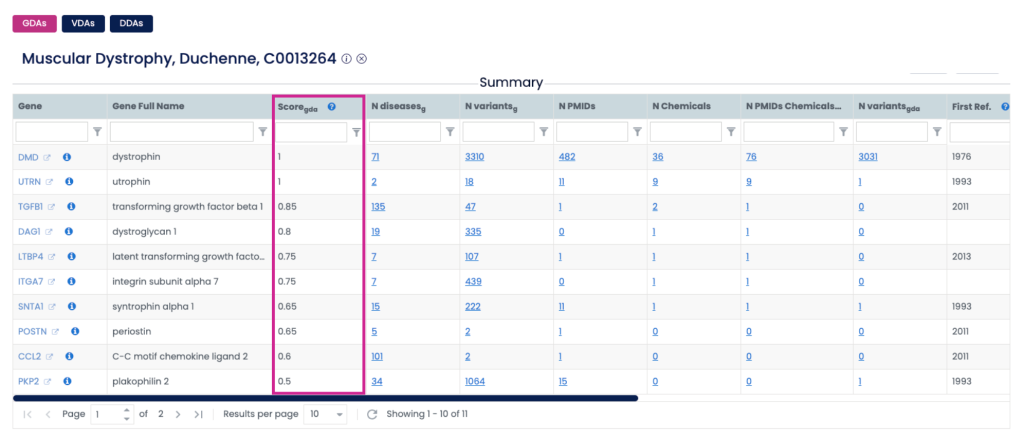
- Summary Table: The first overview after running a query.
- Evidence Table: A detailed breakdown of each association (found under the summary table)
If you don’t see the Score column, click “Select Columns” and enable ScoreGDA or ScoreVDA. You can also rearrange columns or lock important ones for smoother workflows.
Next Steps
For pharma and biotech teams, understanding and using DISGENET GDA and VDA Scores can transform the way you approach research and development.
Start by identifying the highest-confidence associations to guide your drug target validation. Explore medium- and low-scoring associations to uncover potential opportunities for drug repurposing or novel precision medicine candidates.
By incorporating DISGENET Scores into your workflows, you can make smarter, evidence-based decisions, focus resources on the most promising leads, and accelerate the path from discovery to actionable insight.