
When you search DISGENET, you’re not just retrieving associations; you’re working with evidence. And evidence needs to be weighed, compared, and understood in context. That’s what DISGENET’s scoring metrics are designed to help you do.
In this article, we walk through every scoring metric available in DISGENET: what each one measures, how it’s calculated, and when to use it in your research.
The GDA Score and VDA Score: Your Starting Point
The GDA Score (Gene–Disease Association) and VDA Score (Variant–Disease Association) are the core evidence metrics in DISGENET. Every time you run a query, these scores answer the same fundamental question: How confident can you be in this association?
Both scores are composite metrics — they summarize the amount and type of evidence for an association by taking into account the number of sources, their level of curation, publication count, and evidence type. The result is a single number that lets you quickly distinguish well-established associations from emerging, exploratory ones.
How the scores are calculated
The GDA Score is built from five weighted evidence components:
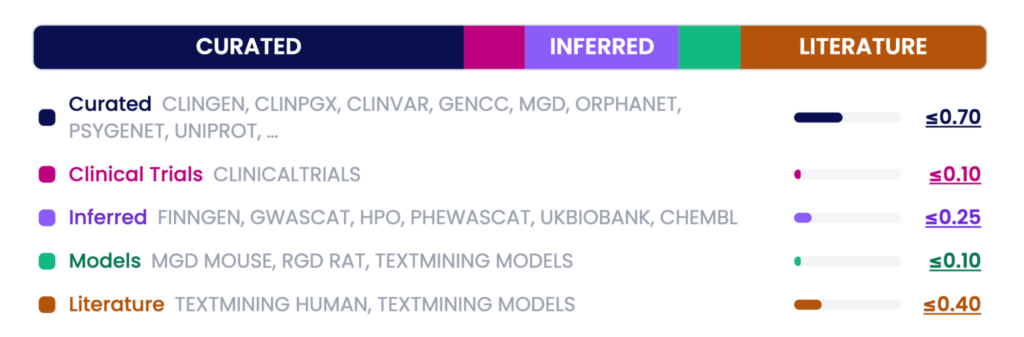
Values (≤ x.xx) represent the maximum contribution each component can make.
- Curated — Expert-reviewed databases including ClinGen, ClinVar, UniProt, Orphanet, and others — up to 0.70
- Clinical Trials — Evidence from ClinicalTrials.gov — up to 0.10
- Inferred — Large-scale genetic and phenotype analyses (GWAS, PheWAS, HPO, ChEMBL, and others) — up to 0.25
- Models — Animal model evidence from RGD, MGD, and literature — up to 0.10
- Literature — PubMed publications from Text-mined data — up to 0.40
The VDA Score uses three components:
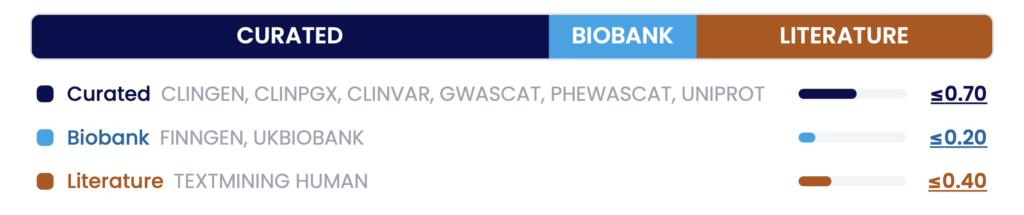
Values (≤ x.xx) represent the maximum contribution each component can make.
- Curated — Expert-reviewed variant databases — up to 0.70
- Biobank — Population-scale genetic studies (FinnGen, UK Biobank) — up to 0.20
- Literature — PubMed publications from Text-mined data — up to 0.40
An important note: The DISGENET Score was originally capped at 1. That cap has now been removed. Associations with exceptionally strong, multi-source support may now exceed 1 — GDA scores can reach up to ~1.55, and VDA scores up to ~1.3. This means the full range of evidence is now visible, rather than compressing the top associations into a single value.
What does the score actually tell you?
| Score range | What it means |
| Close to 1 (or above) | Highly supported — multiple curated resources and more than ten publications |
| Above 0.7 | Backed by more than four expert-curated databases, or by fewer expert-curated databases and other data sources (e.g., Inferred or Biobank) |
| 0.1 – 0.2 | Novel or emerging — few publications, or 1 or 2 inferred sources, no expert curation yet |
High scores are your anchors for established biology. Low scores are where discovery happens.
Where to find it: The GDA and VDA Scores appear in the Summary Table after running a query. If the column is not visible, click Select Columns and enable ScoreGDA or ScoreVDA.
For more details, see the documentation page.
The Normalized Score: Precision Ranking Across the Full Dataset
With the score cap removed, a new challenge emerges: how do you compare associations when scores can now range beyond 1? That’s exactly what the Normalized Score was designed to solve.
The Normalized Score is a min-max normalized version of the GDA and VDA Scores. It rescales all association scores proportionally to a 0–1 range, preserving their relative ordering and differences — without compression or artificial ties at the top.
The key distinction is this: the original score reflects absolute evidence level; the Normalized Score reflects relative position within the dataset.
Why this matters in practice
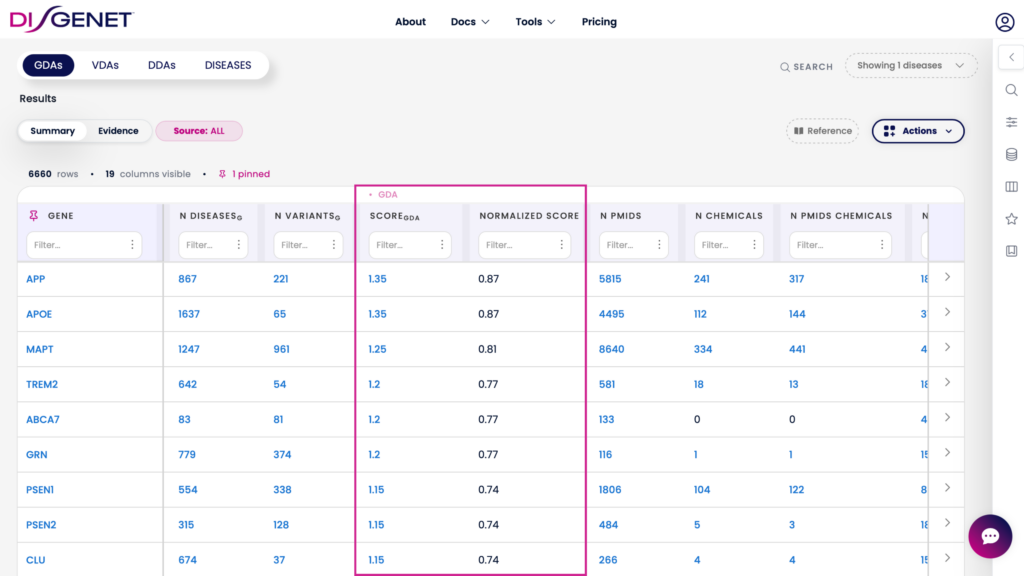
Consider Alzheimer’s Disease genes. With the score cap lifted, genes like APP, APOE, MAPT, TREM2, and ABCA7 appear with a GDA Score of 1.0 — indistinguishable from one another. With the normalization, their scores range from 0.77 to 0.87, making the relative ranking immediately clear and easy to work with downstream.
Use the Normalized Score when:
- Comparing associations across different diseases or genes, where absolute score differences may be misleading.
- You need a strict 0–1 range for downstream analysis or modelling.
- Ranking a large set of candidates where precision matters.
My Score: Prioritization Built Around Your Research
No two research teams weigh evidence the same way. A clinical geneticist and a drug discovery scientist may be looking at the same associations — but with very different priorities. My Score puts that control in your hands.
My Score is a fully customizable scoring metric for GDA and VDA associations. You choose the evidence sources that matter most to your work and assign weights to each — DISGENET then filters the data according to the sources selected and computes a weighted score to rank the associations accordingly.
What you can do with My Score
- Select any combination of sources (e.g., GenCC, UniProt, ClinicalTrials, GWAS Catalog).
- Assign custom weights that sum to 1.
- Save your configuration and reapply it across future searches.
- Make your prioritization method transparent and reproducible across teams.
For example, a pharmacogenomics team might define My Score as:
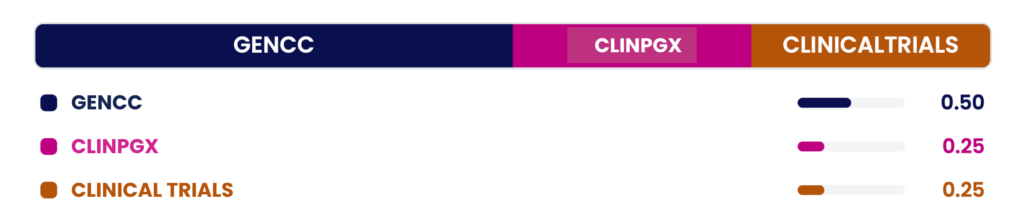
My Score = 0.50 · GenCC + 0.25 · ClinPGx + 0.25 · ClinicalTrials
This configuration filters and ranks associations specifically through the lens of curated clinical relevance — surfacing candidates that align with their internal standards, rather than the platform’s default weighting.
Associations not supported by your selected sources will be filtered out, keeping your results focused.
My Score is available in the web interface and can be saved to your Favorites for reuse. (Available on Standard & Advanced plans.)
Historical Score: Evidence Through Time
Science doesn’t happen all at once. Associations are discovered, confirmed, and sometimes revised over years and decades. The Historical Score lets you explore that timeline.
Introduced in DISGENET v26.2, the Historical Score recalculates the GDA Score using only evidence available within a selected year or range of years. It applies a temporal filter across all evidence types — curated databases, literature, inferred data, clinical trials, and animal models.
How it works
- For specialized databases (e.g., ClinVar, GenCC, and ClinGen), record-level timestamps are used to determine when evidence became available.
- For all sources, supporting publication and clinical trial dates are also used to estimate evidence availability.
- The evidence availability date is defined as the earliest available date, based on either a record-level timestamp or a supporting publication/clinical trial.
- Literature and clinical trial counts, and the final weighted score components are dynamically recomputed using only the evidence available during the selected time period.
- Results are presented as a chart (yearly score and publication/clinical trials) and a score breakdown card.
- Functions to compute and plot the cumulative Historical score are available in the disgenet2r R package.
When to use the Historical Score
- Benchmark a target against what was known before a landmark study or platform update.
- Track evidence trajectories — understanding whether support has built steadily, spiked suddenly, or plateaued.
- Reproduce historical scoring for a specific year, supporting reproducible research and audit trails.
- Train AI/ML models on evidence available up to a given year, then validate their predictive power against what emerged afterward.
Choosing the Right Score
| Score | The question it answers | Best for | Supported tools |
| GDA / VDA Score | How well-supported is this association today? | General prioritization, target validation | Web, REST API, R package, AIDA |
| Normalized Score | How does this association rank relative to all others? | Cross-disease comparisons, downstream analysis | Web, REST API, R package, Cytoscape App, AIDA |
| My Score | How does this association rank by my criteria? | Team-specific prioritization, reproducible workflows | Web |
| Historical Score | How well-supported was this association at a given point in time? | Temporal analysis, benchmarking, ML training | Web, REST API, R package, AIDA |
Each score answers a different question. Used together with other DISGENET data attributes (publication year, citation count, association type, they give you a complete, flexible picture of the evidence landscape.