
As genomic data continues to expand, interpreting the scope of gene–disease associations has become increasingly important. Within DISGENET, two metrics help bring this clarity — Disease Specificity Index (DSI) and Disease Pleiotropy Index (DPI).
These metrics provide important context when exploring gene–disease and variant–disease relationships. This article explains what they measure, why they matter, and how they can support interpretation across different research settings.
The Challenge: Not All Gene–Disease Associations Are Equal
Genes and variants vary widely in how they relate to diseases.
Some are linked to many different conditions, while others appear only in highly specific contexts. Genes associated with many diseases often participate in fundamental, shared disease-response mechanisms—such as inflammation, immune regulation, stress response, or cell-cycle control—that are reused across diverse pathological contexts.
Without a way to quantify this, it becomes a challenge to prioritise potential targets, compare associations, or understand the biology around a gene.
DSI and DPI were created to help users quickly understand:
- Whether a gene or variant is associated with a narrow or broad range of diseases.
- Whether those diseases are similar to each other or span different biological classes.
These metrics do not replace association evidence — they add interpretability.
What is the Disease Specificity Index (DSI)?
The Disease Specificity Index quantifies how many different diseases a gene or variant is associated with.
- A high DSI indicates association with a narrow set of diseases.
- A low DSI suggests the gene or variant is linked to a broader range of diseases.
The DSI ranges from 0.23 to 1 in DISGENET.
If the DSI equals 0, it means the gene or variant is associated only with phenotypes.
Examples from DISGENET
- The gene TNF, a central regulator of inflammation and immune signaling, is associated with more than 3,500 diseases and has a DSI of 0.23, reflecting a broad disease spectrum.
- MOB3A, associated with a single disease, has a DSI of 1, indicating extremely narrow disease specificity.
DSI is helpful when assessing whether a gene is involved in many different diseases or is specific to only a few.
Note: The examples and values shown in this article are for illustrative purposes. Actual DSI scores in DISGENET may vary as the database is updated.
What is the Disease Pleiotropy Index (DPI)?
While DSI measures specificity, the Disease Pleiotropy Index measures diversity — specifically, how similar or different the associated diseases are according to MeSH disease classes.
- A low DPI indicates the diseases fall within closely related MeSH classes.
- A high DPI suggests a wider range of disease classes, meaning greater pleiotropy.
The DPI ranges from 0 to 1.
If DPI is missing, it means the gene or variant is associated only with phenotypes or with diseases that cannot be mapped to MeSH classes.
Examples from DISGENET
- KCNT1, associated with 39 diseases across 5 MeSH classes, has a DPI of ~0.172, indicating a relatively diverse but still modest range of disease classes.
- APOE, linked to more than 700 diseases across 27 disease classes, has a DPI of 0.931, meaning its associated diseases span many unrelated categories.
DPI provides context about biological similarity among associated conditions.
Note: The examples and values shown in this article are for illustrative purposes. Actual DPI scores in DISGENET may vary as the database is updated.
Interpreting Disease Specificity Index and Disease Pleiotropy Index Together
Although each metric is informative on its own, they become especially useful when interpreted together.
For example:
- A low DSI + low DPI suggests a gene or variant associated with many diseases that are still biologically related.
- A low DSI + high DPI indicates association with many diseases across very different MeSH classes.
- A high DSI + low DPI points to a gene or variant linked to a small number of diseases within a similar disease category.
- A high DSI + high DPI is less common, indicating specificity combined with diverse disease classes.
Seeing how DSI and DPI align helps clarify whether a gene’s or variant’s disease involvement is broad, narrow, cohesive, or diverse.
How DPI and DSI Support Research and Interpretation
Different teams benefit from these indicators in different ways:
For clinicians and clinical researchers
A clinician evaluating a patient with complex neurological symptoms encounters a gene reported across many conditions.
The gene appears in dozens of associations → unclear whether it is relevant to a neurological presentation or simply linked broadly across unrelated conditions.
After using DSI/DPI:
- Low DPI shows that the associated diseases all fall within related neurological MeSH classes, suggesting the associations are biologically cohesive.
- Low DSI indicates the gene is linked to only a narrow set of neurological conditions.
The clinician can focus on a smaller, more meaningful diagnostic space instead of interpreting a long list of associations.
For R&D and drug discovery teams
A discovery scientist assessing whether a candidate gene is too “promiscuous” to be a viable therapeutic target.
The gene appears across many diseases → uncertainty whether the breadth reflects true biology or misleading, heterogeneous associations.
After using DSI/DPI:
- Low DSI confirms the gene is involved in a wide range of diseases.
- High DPI reveals these diseases span multiple unrelated classes, indicating diverse biological involvement.
This pattern warns that the gene may be difficult to target selectively, supporting deprioritization early in the evaluation process.
For bioinformaticians and data scientists
A researcher reviewing a noisy list of hits from a GWAS or automated text-mining pipeline.
All candidate genes appear similar in weight → difficult to distinguish broadly connected genes from those with specific, interpretable roles.
After using DSI/DPI:
- High DSI genes stand out as highly specific, allowing fast identification of focused disease involvement.
- Low DPI reveals clusters of genes associated with tightly related disease classes.
The researcher can filter noisy outputs more efficiently and prioritize genes with clearer biological profiles.
For academics and students
A student is trying to understand why some genes are linked to only one disease while others appear across many.
Gene lists feel arbitrary and hard to interpret without context.
After using DSI/DPI:
- DSI provides a quantifiable measure of how narrow or broad those associations are.
- DPI shows whether the involved diseases share biological similarity or span different categories.
DSI and DPI become teaching tools for introducing core concepts such as specificity and pleiotropy in disease biology.
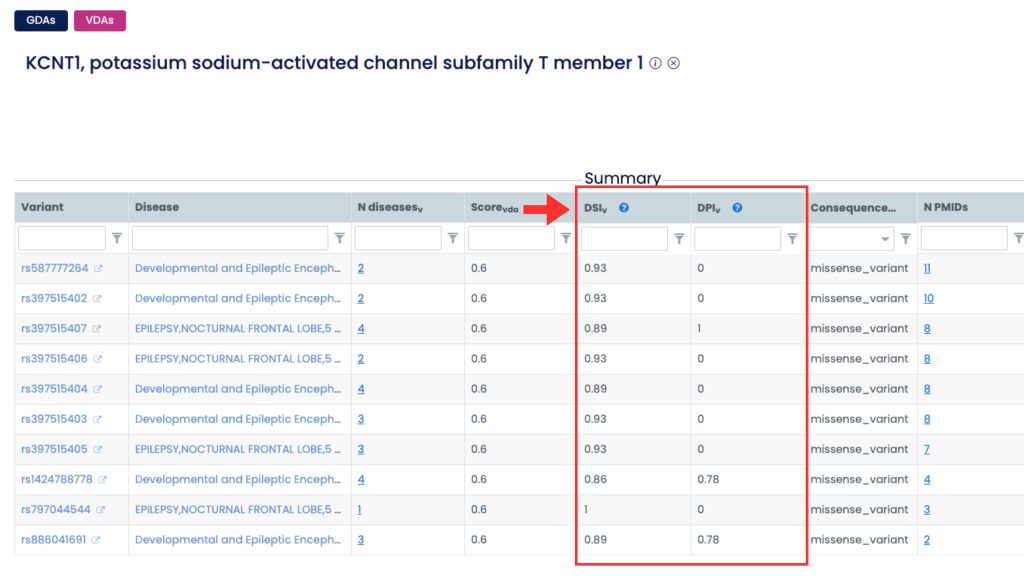
Where to Find DSI and DPI in DISGENET
Both metrics appear in Gene–Disease Associations (GDAs) and Variant–Disease Associations (VDAs) tables within DISGENET. You can:
- View DSI and DPI values directly in the table
- Sort or filter based on the metrics
- Use them to refine candidate lists or better understand association patterns.
These indicators complement the existing evidence and score fields in the platform, providing a clearer picture of a gene or variant’s disease profile.
If DSI and DPI are not visible in the summary table by default, you can add them using the “Select Columns” menu located in the upper-right corner of the table.
Clicking this button opens a panel with all available fields, organized into three groups: GDA, Disease, and Gene.
The DSI and DPI metrics are listed under the Gene group. Simply check the boxes next to these metrics to display them in your table.
Conclusion
Disease Specificity Index and Disease Pleiotropy Index offer two simple but informative ways to understand the behaviour of genes and variants across human diseases.
- DSI describes whether a gene or variant is associated with a narrow or broad range of diseases.
- DPI describes how similar or diverse those diseases are across MeSH classes.
Together, they help teams interpret associations more effectively, compare gene profiles, and navigate complex disease landscapes with greater clarity.
Whether you are exploring disease mechanisms, evaluating potential targets, or simply trying to understand the biological role of a gene, these metrics provide an additional layer of insight within DISGENET.