
Every gene in DISGENET is linked to one or more diseases or phenotypes — for some genes, just one; for others, hundreds. Scrolling through those associations tells you what a gene is associated with, but not the more interesting question: what kind of disease profile does that gene have?
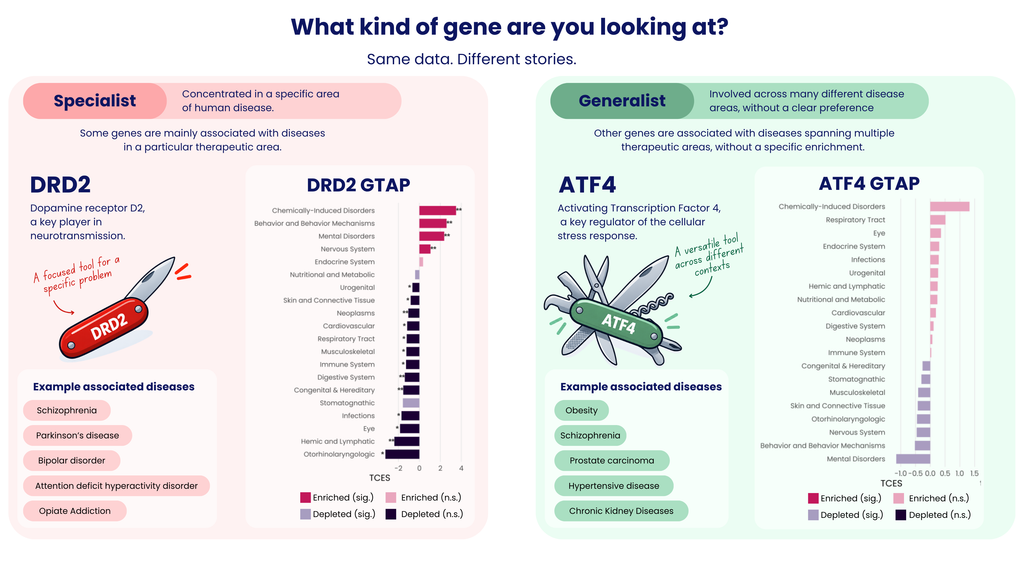
At the extremes, two very different gene “personalities” emerge. Some genes behave like specialists, with their disease associations concentrated within a coherent area. DRD2, for example, shows a focused neuropsychiatric and behavioral profile.
Others look more like generalists, appearing across very different areas of human disease without a single area dominating. ATF4, a transcriptional regulator of fundamental cellular stress responses, is associated with diseases and phenotypes across many disease classes without a clear preferential enrichment.
Think of these extremes as a simple knife versus a Swiss Army knife: one has a clear focus, while the other operates across many different contexts. Many genes, of course, fall somewhere in between.
GTAP — the Gene Therapeutic Area Profile — is built to reveal this spectrum.
What GTAP Actually Shows You
Some genes in DISGENET are associated with hundreds of diseases and phenotypes. But the number of associations alone doesn’t tell you whether those associations are concentrated in a particular disease area or broadly distributed across many. And because some disease classes are much more represented in DISGENET than others, raw class counts can be misleading.
GTAP puts those counts into context. For every gene, it compares how its associated diseases and phenotypes are distributed across major MeSH disease classes — Neoplasms, Nervous System Diseases, Cardiovascular Diseases, Infections, and so on — with the distribution of those classes across DISGENET as a whole.
For each class, the Therapeutic Class Enrichment Score (TCES) measures the magnitude and direction of that difference: a positive score indicates enrichment, a negative score indicates depletion, and a score around zero means that the class is represented roughly as expected from the DISGENET background.
But a difference in proportions does not necessarily mean that the difference is statistically meaningful. GTAP therefore uses a binomial test for each gene–disease class pair, asking whether the observed number of associations in that class is higher or lower than expected given the overall frequency of the class in DISGENET. P-values are corrected for multiple testing using the Benjamini–Hochberg procedure.
The result is a profile that shows not only where a gene’s disease associations lie, but also which disease classes are significantly over- or under-represented relative to the DISGENET background.
Put a gene’s GTAP profile next to its raw disease list, and the picture snaps into focus immediately.
The Biology Forms Coherent Profiles
We ran GTAP across the full DISGENET gene set, and the resulting profiles reveal biologically coherent patterns. Importantly, enrichment is rarely confined to a single disease class. Therapeutic areas should not be viewed as isolated compartments: diseases can share mechanisms, affected systems, and clinical manifestations, and individual diseases may also map to more than one MeSH class. This structure is reflected in the GTAP profiles.
PCSK9 shows a coherent metabolic–cardiovascular pattern, with strong enrichment in Nutritional and Metabolic Diseases and Cardiovascular Diseases — two closely connected therapeutic areas that reflect its established role in lipid metabolism and cardiovascular disease.
JAK2 illustrates how disease areas can intersect. Its profile combines a strong enrichment in Hemic and Lymphatic Diseases with enrichment in Cardiovascular Diseases, largely driven by thrombotic and vascular associations linked to JAK2-mutant myeloproliferative disease.
Other genes reveal different combinations. IL15 is enriched across Infections, Immune System Diseases, and Hemic and Lymphatic Diseases, while TNF shows enrichment spanning Infections, Immune System Diseases, Hemic and Lymphatic Diseases, and Chemically-Induced Disorders. Again, the signal is not restricted to a single class but extends across biologically related areas.
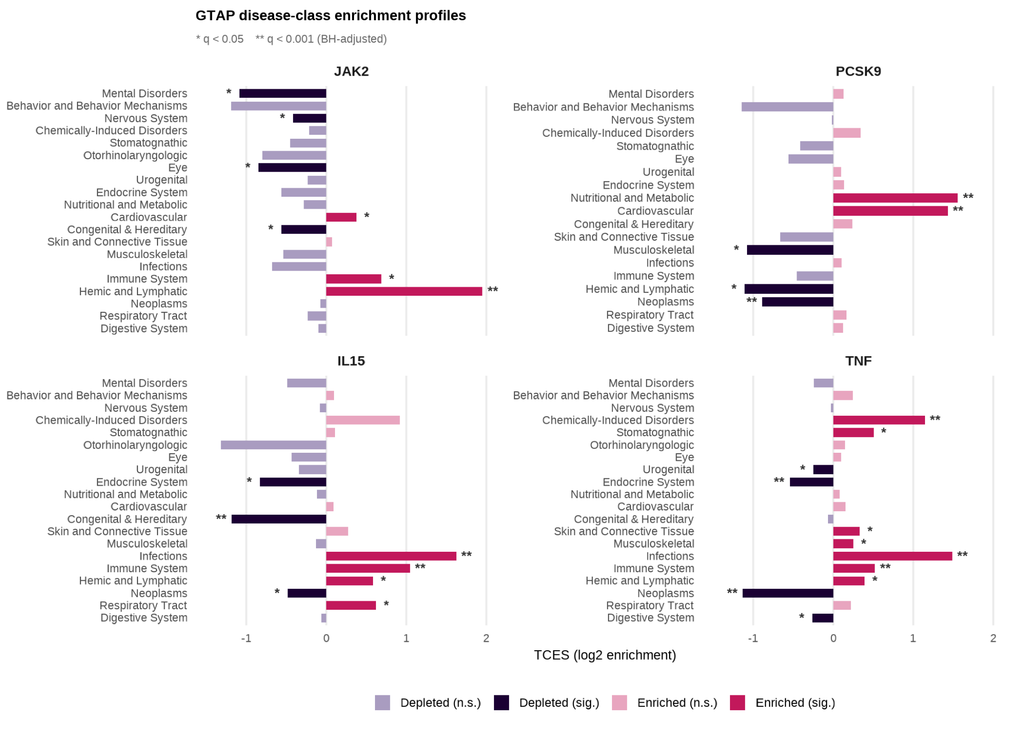
This is an important feature of GTAP: a gene’s GTAP should be interpreted as a profile across disease classes, rather than focusing on each enriched class in isolation. Related disease areas can appear together, giving each gene a characteristic disease-area fingerprint.
And this is also where background correction matters. Having many associations in a disease class does not necessarily mean that a gene is enriched in that class. GTAP asks whether that class represents a larger — or smaller — share of the gene’s associations than expected from its overall prevalence in DISGENET.
From Specialists to Generalists
Line up enough GTAP profiles and a spectrum of gene “personalities” begins to emerge.
At one end are specialists, whose associations show a clear preference for a coherent area of human disease. DRD2 is a good example: its strongest enrichments fall in Mental Disorders, Behavior and Behavior Mechanisms, and Nervous System Diseases. These are different MeSH classes, but together they form a recognizable neuropsychiatric and behavioral profile. Like the simple knife in the figure, DRD2 has a clear disease-area focus.
At the other end are generalists. ATF4, a key regulator of the cellular stress response, is associated with diseases spanning many therapeutic areas, yet none shows significant enrichment relative to the DISGENET background. Its GTAP profile is therefore much flatter, without a single disease area clearly dominating. Like a Swiss Army knife, ATF4 appears across many different disease contexts rather than showing a strong preference for one.
These are useful extremes, not rigid categories. Many genes fall somewhere between them, with enrichment across several related disease classes. As the examples above show, those combinations can themselves be biologically informative: PCSK9 connects metabolic and cardiovascular disease, while JAK2 connects hematological disease with thrombotic and vascular manifestations.
The important distinction is therefore not simply whether a gene is a “specialist” or a “generalist,” but how its disease associations are distributed across therapeutic areas.
This is where breadth and enrichment are not the same thing. A gene can be associated with hundreds of diseases and phenotypes and still have no significantly enriched disease class. Conversely, a gene with many associations can have a pronounced GTAP profile if those associations are disproportionately concentrated within one or several related areas.
GTAP makes this spectrum visible at a glance: from genes with a recognizable disease-area focus to genes with broader, flatter profiles — and all the biologically meaningful patterns in between.
How Does This Relate to DSI and DPI?
If you’ve used DISGENET before, this might sound familiar — and it should. DSI (Disease Specificity Index) already tells you whether a gene is associated with a narrow or broad set of diseases. DPI (Disease Pleiotropy Index) tells you whether those diseases are concentrated within a few disease classes or spread across many.
GTAP doesn’t replace either of those — it complements them.
DSI and DPI give you a single number, a fast way to compare genes at a glance. GTAP shows you the shape behind that number. Two genes can have very similar DPI scores — both concentrated or both spread out — while being associated with completely different disease classes. DPI alone can’t tell them apart.
GTAP can, because it shows you exactly which classes a gene’s disease involvement lies in and whether those classes are over- or under-represented relative to the DISGENET background.
Think of DSI and DPI as summary statistics, and GTAP as the disease-area fingerprint that adds biological context to them.
Why This Matters for Target Discovery
If you’re prioritizing targets, comparing candidate genes, or just trying to build intuition about a gene you’ve never worked with before, GTAP gives you a shortcut. Instead of reading through a disease list one entry at a time, you can see the shape of a gene’s disease relevance in a single profile.
And because GTAP accounts for the underlying distribution of disease classes in DISGENET, it helps distinguish a gene that simply has many associations from one whose associations show a genuine preference for particular disease areas.
It also preserves something that a single summary statistic cannot: the structure of that preference. A gene may point strongly toward one disease domain, connect several related therapeutic areas, or show a broad profile without any particular area dominating.
It’s a simple idea, but it can reveal patterns across the DISGENET dataset that would otherwise take a lot of manual digging to spot.
Try It Yourself
GTAP profiles are now available for genes across the DISGENET platform. Pull up a gene you know well and see if its profile matches your intuition — or surprises you.